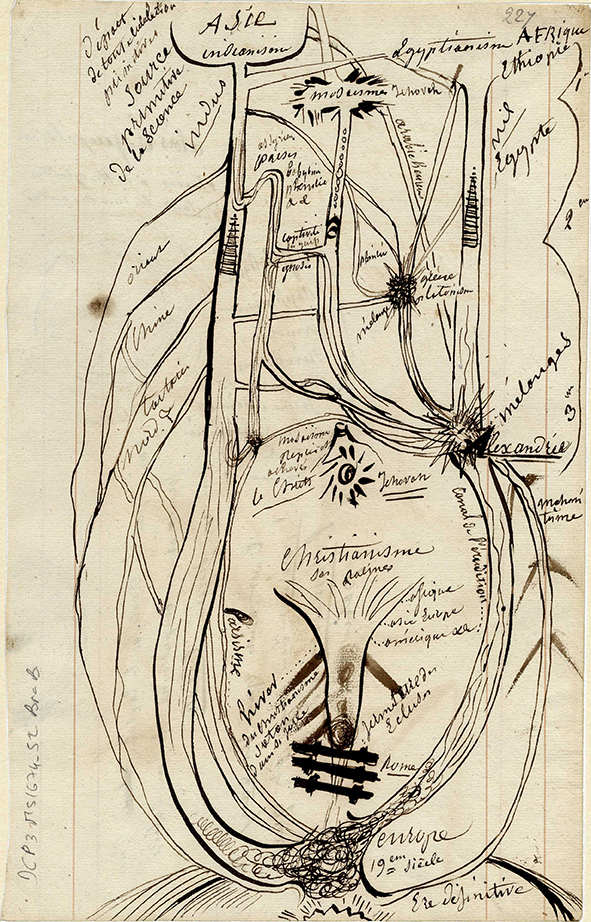
Théophile Bra, Asie, indianisme… Christianisme, 1826-1851 ?, encre brune métallogallique sur papier, 24,5 x 18 cm, Douai, bibliothèque Marceline Desbordes-Valmore
Appel à communication : « Le dessin visionnaire et ses savoirs : diagrammes d’artistes » (6-7 juin 2024, Strasbourg)
Workshop organisé dans le cadre du programme « Le dessin visionnaire et ses savoirs. À partir de l’étude et de la valorisation du fonds d’archives de Théophile Bra » (Institut d’études avancées de Strasbourg – USIAS).
“The visionary drawing and its knowledge: artists’ diagrams”
Workshop organised as part of the research programme The visionary drawing and its knowledge. From the study and valorization of the archives of Théophile Bra (University of Strasbourg Institute of Advanced Studies – USIAS). (English below)
„Die visionäre Zeichnung und ihr Wissen: Künstlerdiagramme“
Dieser Workshop ist Teil des Forschungsprogramms Die visionäre Zeichnung und ihr Wissen. Studie und Valorisierung des Archivbestands von Théophile Bra (University of Strasbourg Institute for Advanced Studies – USIAS). (Deutsch unten)
J’ai exécuté un moulin à café que j’ai fait éclater ; la poudre tombe à côté, les engrenages sont en haut et la poignée est vue simultanément à plusieurs points de son circuit avec une flèche pour indiquer le mouvement. Sans le savoir, j’avais ouvert une fenêtre sur quelque chose d’autre. Cette flèche était une innovation qui me plaisait beaucoup, le côté diagrammatique était intéressant du point de vue esthétique. (Marcel Duchamp, Entretiens avec Pierre Cabanne, Paris, 1967, p. 38-39)
The diagrammatic methods of the “new math” have led to a curious phenomenon. Namely, a more visible math that is unconcerned with size or shape in any metrical sense. The “paper and pencil operations” that deal with the invisible structure of nature have found new models, and have been combined with some of the more fragile states of mind. (Robert Smithson, « Entropy and the New Monument » [1966], in J. Flam (éd.), Robert Smithson. The Collected Writings, University of California Press, 1996, p. 10-23)
S’il est un tracé graphique qui porte en lui le désir d’une visualisation de l’invisible, c’est le diagramme. Le workshop entend examiner la manière dont les artistes s’en sont emparés aux XIXe et XXe siècles. En favorisant les études de cas, il vise à renouveler l’étude des diagrammes d’artistes et d’écrivains déjà identifiés et à mettre au jour des corpus artistiques inédits, afin de comprendre leur fonctionnement en tant qu’image et processus de pensée, ainsi que leurs relations aux modes de visualisation scientifique de leur temps.
Par son étymologie, le latin diagram-ma – emprunté au grec ancien diagraphein (διάγραμμα), de dia (à travers) et graphein (écrire) – associe ligne, inscription et processus de traversée. La définition du diagramme est labile, mais on y compte habituellement les représentations graphiques schématiques qui mettent en relation des données abstraites, telles que les arbres (généalogiques ou historiques), la cartographie céleste ou terrestre, les listes et tableaux relationnels, les configurations multidirectionnelles, circulaires, radiales, en courbes ou en colonnes. Comme l’explique Laurence Dahan-Gaida, « s’il appelle immédiatement l’idée de graphisme, le diagramme se singularise par sa nature composite qui fait de lui un hybride d’écriture et de dessin, dont les capacités cognitives dépassent celle de chacune de ces deux classes de signes […], dont la fonction plus générale est de rendre pensable et compréhensible quelque chose dont on n’aurait pu parler en passant par la représentation verbale » (Dahan-Gaida 2023, p. 12). C’est ainsi que la plupart des diagrammes mettent en relation des éléments d’image, de texte et parfois de données chiffrées dans un espace bidimensionnel. Ils font converger le dissemblable ou le diachronique de manière topologique et synchrone (Bender/Marrinan 2010). Dans le contexte médiéval, Madeline H. Caviness compare les diagrammes cosmiques et religieux à une « troisième façon de voir », entre l’œil corporel et la vision spirituelle, et intervenant juste avant cette dernière (Caviness 1983). Les diagrammes ont alors également une fonction mnémonique et didactique (Schmitt 1989 et 2019, Norman 2006, Müller 2008). À partir de la Renaissance apparaissent les diagrammes techniques et fonctionnels à visée scientifique. Ils servent de plus en plus souvent à organiser de manière visuelle des données géographiques, économiques, sociales et politiques, à l’exemple des statistiques (Gormans 2000). Le développement de l’imprimé, puis de la presse au XIXe siècle, intensifie la diffusion d’une véritable méthode graphique moderne, qui favorise sa réception par les artistes (Schneider 2014). Visant à réduire l’écart entre le visible d’une part, et les échelles, les forces ou les évolutions invisibles d’autre part, le diagramme scientifique semble alors habité par le désir d’une maîtrise de l’accélération et de l’accumulation des connaissances, d’une réponse à l’incertitude et à l’angoisse suscitées par le chaos et le devenir. L’ordre suggéré par les diagrammes est ainsi souvent sous-tendu par une certaine vision du monde et de la société, qu’il établisse des hiérarchies, comme cela est souvent le cas des diagrammes arborescents, ou qu’il traite les données de manière plus égalitaires, par exemple les diagrammes en cercle ou en rhizomes (Poggenpohl/Winckler 1992). Cependant, à partir des travaux de Charles Sanders Peirce, l’apparente fixité du diagramme est remise en question par sa capacité à féconder les idées. Émerge l’idée qu’il est une « chose épistémique » plus qu’une simple illustration (Rheinberger 2001). En en faisant une sous-classe des icônes, Peirce s’intéresse à leur rapport de similitude et d’analogie avec leur objet de référence, ainsi qu’à leur dimension d’image, tout en y reconnaissant un médium de la pensée susceptible de participer à l’acquisition et à la production de connaissances à la fois. Peirce insiste sur la dimension relationnelle du diagramme, qu’il s’agisse d’objets, de concepts ou d’idées, voire de différents champs de la connaissance, une dimension qui nécessite une manipulation et une interprétation expérimentales et opératives des figures, légendes, symboles, chiffres, points, lignes ou flèches qu’il rassemble (Dahan-Gaida 2023, Krämer 2009). Le diagramme engage ainsi autant sa configuration par le dessinateur et que sa reconfiguration par ses récepteurs, la déduction de ses règles fonctionnelles autant qu’une capacité à percer ce qui reste en lui de mystérieux (Stjernfeld 2007). C’est la raison pour laquelle Gilles Châtelet, dans la perspective d’une épistémologie des sciences, envisage les diagrammes comme des « multiplicateurs de virtualités » et des « producteurs d’ambiguïté » susceptibles de condenser et d’amplifier une intuition sur un mode reliant passé et futur (Châtelet 1993, Saint-Ours 2004). Châtelet insiste aussi sur leur ancrage dans le geste du tracé, qui renoue les liens entre pratique, activité théorique et réactivation sémantico-poétique. Sur ces prémisses, l’intérêt pour l’étude des diagrammes rejoint celui pour la créativité visuelle dans la pratique des sciences (Galison/Jones 1998, Daston/Galison 2012). Il se renforce au sein des pictorial et iconic turns visant à détrôner le logocentrisme au profit d’une prise en considération du fonctionnement des images (Mitchell 1994, Böhm 1994 et 2010) et du rôle qu’y joue la « main pensante » (Bredekamp 2007). Cet intérêt prend une telle ampleur que Steffen et Felix Thürlemann en appellent en 2002 à un diagrammatical turn (Bogen/Thürlemann 2002), qui ouvre la voie à une grande richesse de réflexion (par ex. Stjernfeld 2007, Bauer/Ernst 2010, Krämer 2009, 2012 et 2016). L’idée d’une « diagrammatologie » a notamment conduit à interpréter par ce prisme des images ou des textes qui ne se présentent pas à première vue comme des diagrammes (Bogen 2005, Dahan-Gaida 2023). Rappelons que dans Logique de la sensation, Gilles Deleuze envisageait déjà comme un diagramme les « marques » (traits-lignes, taches -couleurs) affectant, chez Francis Bacon, l’image figurative, et dont la fonction était « de provoquer le désordre et le chaos en détruisant un régime significatif déjà existant » tout en générant une nouvelle « capture de forces » (Dahan-Gaida 2023, p. 53). Les questions soulevées par cette extension de la réflexion sur le diagramme sont susceptibles de nourrir les discussions du workshop. Nous proposons toutefois aux intervenant.e.s de placer au cœur de leurs présentation l’examen des diagrammes dessinés par les artistes et écrivains des XIXe et XXe siècles avant d’aborder l’éventualité d’une diagrammatisation générique des arts. On pourra par exemple s’intéresser à la manière dont les artistes côtoient le vaste corpus des diagrammes religieux ou scientifiques, occidentaux ou non-occidentaux, afin d’en examiner les parentés et les divergences. D’un côté, les diagrammes introduisent créativité et esthétique dans les pratiques scientifiques (Baigrie 1996). De l’autre, leur spectacle met à l’épreuve de l’image les réalités insaisissables qu’il convoque. C’est pourquoi, comme le remarque Brian Rotman, les diagrammes ont toujours paru suspects, tant aux scientifiques pour leur insuffisance formelle et leur ouverture à l’interprétation subjective, qu’aux humanistes pour leur parenté avec la science et sa croyance en une vérité universelle (Rotman 1999). Comment les artistes des XIXe et XXe siècle abordent-ils cette tension ? Telle est l’une des questions que l’on souhaiterait aborder dans le workshop.
En histoire de l’art, les diagrammes scientifiques ont commencé à être étudiés sous un angle esthétique, par exemple en examinant les différences entre leurs formes dessinées et imprimées (Bredekamp 2022). Les chercheurs se sont par ailleurs largement intéressés aux diagrammes d’histoire de l’art, dont la couverture de Cubism and Abstract Art (1936) d’Alfred Barr ou Der Bilderatlas Mnemosyne d’Aby Warburg (1828-1829) sont devenus des exemples paradigmatiques (Maldonado 2006, Schmidt-Burkhardt 2012, Cortjaens/Heck 2014, Fontán del Junco 2019). Ces études ont également mis au jour la participation des artistes à la visualisation des généalogies artistiques, en particulier dans le futurisme italien (Hanson 1983) et le constructivisme russe (Hemken 1991), chez les artistes américains (par ex. Ad Reinhardt, Robert Motherwell), au sein des groupes SPUR et CoBrA (Birtwistle 1994). Enfin, les pratiques diagrammatiques des artistes et écrivains des XIXe et XXe siècle ont été identifiées et analysées (cf. le florilège d’exemples dans Caraës/Marchand-Zañartu 2011 et Marchand-Zañartu/Lauxerois 2020 ). Sans prétendre à l’exhaustivité, on peut citer Walter Crane (Brockington 2013), Rudolf Steiner (Schweigler 1941, Scotti/Kugler 2011), Paul Klee (Rehm 2017, Rottmann 2020-2), Vassily Kandinsky (Leonhard 2005) ou plus largement le Bauhaus (Troels 1974, Fer 1993, Gough 2005, Rohde 2020) dans le cadre de l’enseignement. Dans cette perspective, plusieurs études ont mis en évidence la participation des artistes à la visualisation graphique des données, à l’exemple de la collaboration d’Otto Neurath avec Gerd Arntz (Hartmann/Bauer 2003) ou d’El Lissitzky et Hans Arp pour Les ismes dans l’art (Schmidt-Burkhardt 2005). Le contexte du dessin technique a également conduit à évaluer son rôle dans les listes et généalogies du surréalisme (Werner 2002) et les diagrammes Dada (Nesbit 1991, Joselit 2005, Bogen 2006, Wild 2015, Wildgen 2015). Leur importance dans le contexte américain a été soulignée (Shiff 2005, Buchloh 2006) et certaines de leurs occurrences étudiées dans le Pop Art (Buchloh 1989, Vogt 2008, Gilbertson 2009), le mouvement Fluxus (Harren 2008, Bardiot 2006, Schmidt-Burkhardt 2003, 2012, 2013), l’art minimal, conceptuel et sériel (Geelhaar 1980, Holert 2012, Buchloh 2013, Rottmann 2020-1). Ces derniers exemples montrent que le diagramme participe d’une émancipation à l’égard de la figuration, d’une extension du domaine de l’art – nous pensons aussi à son rôle dans l’Internationale Situationniste –, voire du phénomène de dématérialisation de l’art théorisé par Lucy Lippard et John Chandler (Harren 2008). Cependant, les diagrammes d’artistes possèdent également une dimension matérielle, procédant de l’inscription sur un support, fusse-t-il de papier. Elle est particulièrement sensible lorsque la subjectivité gestuelle s’y manifeste, à l’instar des diagrammes des artistes autodidactes dits « bruts » et « outsider » (par ex. « Hétérotopies scientifiques », in Decharme/Safarova 2014 et Barbara 2021). Par ailleurs, les diagrammes d’artistes associent souvent abstraction et figuration, comme c’est le cas dans le Pop Art à la différence de l’art sériel, conceptuel et les premiers essais de computer art (Rottmann 2020-1 et 2021). Ces tensions des diagrammes d’artistes rejoignent celle d’un partage de vérité entre art et science. Oscillant entre l’effacement de l’artiste devant la donnée et la réappropriation subjective, ils continuent d’interroger les facultés visionnaires du dessin dans la modernité, comme ce fut par exemple explicitement le cas chez Théophile Bra, Walter Russell, Hilma af Klint, Emma Kunz et Joseph Beuys (Harlan/Zumdick 2020). En somme, comme l’affirme Max Holert, « on ne peut donc répondre qu’au cas par cas à la question de savoir pourquoi et comment ont été utilisées et mises en circulation de plus en plus de formes de représentation qui ressemblaient certes à des images éminemment utiles, mais qui, en règle générale, ne faisaient que suggérer la fonctionnalité, l’entouraient de scepticisme et d’ironie, voire la critiquaient » (Holert 2012, p. 141, voir aussi « Der Witz im Diagramm », in Schmidt-Burkhardt 2012, p. 293-302). En d’autres termes, si « l’espace de liberté que laisse le diagramme à la réception est un indicateur de la marge de manœuvre dont une culture essaie de tirer parti dans le monde » [Die Freiheit, die das Diagramm in der Rezeption lässt, wird zum Indikator für den Spielraum, den eine Kultur in der Welt auszuschöpfen versucht] (Bogen 2011, p. 233), quelle est celui que ménagent les diagrammes d’artistes ?
Pour alimenter ces questions, les propositions se concentreront sur les corpus des artistes et des écrivains des XIXe et XXe siècle, afin de favoriser les discussions sur l’archéologie de l’usage artistique des diagrammes avant les années 1980, où la révolution des diagrammes numériques générés par ordinateur s’est intensifiée.
Comité de sélection
Laurence Dahan-Gaida, professeure de littérature comparée, université de Franche-Comté, directrice du Centre de Recherches Interdisciplinaires et Transculturelles et de la revue Epistémocritique.
Hugo Daniel, responsable de l’École des Modernités, chargé de mission curatoriale, Fondation Giacometti.
Marine Pagès, artiste et enseignante, École européenne supérieure de l’image de Poitiers (confirmé)
Julie Ramos, professeure d’histoire de l’art contemporain, université de Strasbourg, et Fellow de l’USIAS.
Michael Rottmann, post-doctorant dans l’ERC COSE à l’Institut für Kunst- und Baugeschichte (IKB) du Karlsruher Institut für Technologie (KIT).
Informations pratiques
Workshop prévu les 6 et 7 juin 2024 à l’Université de Strasbourg.
Langues : français, anglais
Les propositions d’interventions, composées d’un titre, d’une présentation d’environ 3000 caractères espaces compris et d’une notice biographique d’environ 1000 caractères espaces compris sont à envoyés avant le 31 décembre 2023 à l’adresse suivante : de**********************@***il.com
Les intervenant.e.s retenu.e.s devront fournir un synopsis de leur intervention fin avril. Une publication réunissant les trois workshops du programme – « Portraits et Visages » (19-20 oct. 2023), « Orients » (7-8 décembre), « Diagrammes d’artistes » (6-7 juin 2024) – sera envisagée à l’issue de leur tenue.
I made a coffee grinder that I blew up; the powder falls to the side, the gears are on top and the handle is seen simultaneously at several points in its circuit with an arrow to indicate the movement. Without realising it, I had opened a window towards something else. The arrow was an innovation that I really liked, the diagrammatic aspect was interesting from an aesthetic point of view. (Marcel Duchamp, Entretiens avec Pierre Cabanne, Paris, 1967, p. 38-39)
The diagrammatic methods of the “new math” have led to a curious phenomenon. Namely, a more visible math that is unconcerned with size or shape in any metrical sense. The “paper and pencil operations” that deal with the invisible structure of nature have found new models, and have been combined with some of the more fragile states of mind. (Robert Smithson, « Entropy and the New Monument » [1966], in J. Flam (éd.), Robert Smithson. The Collected Writings, University of California Press, 1996, p. 10-23)
If ever there was a graphic line that carried the desire to visualise the invisible, it is the diagram. This workshop aims to examine the way in which artists used diagrams in the nineteenth and twentieth centuries. By favouring case studies, it aims to renew the study of artists’ and writers’ diagrams that have already been identified and to bring to light previously unidentified artistic works, in order to understand how they function as images and thought processes, as well as their relationship to the scientific modes of visualisation of their time.
By its etymology, the Latin diagram-ma – borrowed from the ancient Greek diagraphein (διάγραμμα), from dia (to cross) and graphein (to write) – associates line, inscription and the process of passage. The definition of the diagram is fluctuant, but it usually includes schematic graphic representations that relate abstract data, such as trees (genealogical or historical), celestial or terrestrial cartography, relational lists and tables as well as multidirectional, circular, radial, curved or columnar configurations. As Laurence Dahan-Gaida explains, “although it immediately calls to mind the idea of graphics, the diagram stands out because of its composite nature, which makes it a hybrid of writing and drawing, with cognitive capacities that exceed those of each of these two classes of signs […], whose more general function is to render thinkable and comprehensible something that cannot be spoken of through verbal representation” (Dahan-Gaida 2023, p. 12). This is how most diagrams relate elements of image, text and sometimes numerical data in a two-dimensional space. They bring together the dissimilar or the diachronic in a topological and synchronous way (Bender/Marrinan 2010). In the medieval context, Madeline H. Caviness compares cosmic and religious diagrams to a “third way of seeing”, between the bodily eye and spiritual vision, and intervening just before the latter (Caviness 1983). Diagrams also have a mnemonic and didactic function (Schmitt 1989 and 2019, Norman 2006, Müller 2008). From the Renaissance onwards, technical and functional diagrams appeared for scientific purposes. They were increasingly used to visually organise geographical, economic, social and political data, as in the case of statistics (Gormans 2000). The development of prints, followed by the press in the nineteenth century, intensified the circulation of a truly modern graphic method, which facilitated its reception by artists (Schneider 2014). Intended to reduce the gap between the visible on the one hand, and scales, forces or invisible evolutions on the other, the scientific diagram seems to be driven by the desire to master the acceleration and accumulation of knowledge, and to respond to the uncertainty and anxiety caused by chaos and change. The order suggested by diagrams is therefore often rooted in a certain vision of the world and of society, whether it establishes hierarchies, as is often the case with tree diagrams, or treats data in a more egalitarian way, as in circle or rhizome diagrams (Poggenpohl/Winckler 1992). However, with the work of Charles Sanders Peirce, the apparent immobility of the diagram was challenged by its ability to stimulate ideas. The belief emerged that it was an “epistemic thing” rather than a simple illustration (Rheinberger 2001). By making them a subclass of icons, Peirce is interested in their relationship of similarity and analogy with their object of reference, as well as their pictorial dimension, while at the same time recognising them as a medium of thought capable of participating both in the acquisition and production of knowledge. Peirce insists on the relational dimension of the diagram, whether it concerns objects, concepts or ideas, or even different fields of knowledge, a dimension that requires experimental and operative manipulation and interpretation of the figures, captions, symbols, numbers, points, lines or arrows that it brings together (Dahan-Gaida 2023, Krämer 2009). The diagram thus involves both its configuration by the designer and its reconfiguration by its audience, the deduction of its functional rules as much as an ability to unravel its mysteries (Stjernfeld 2007). For this reason, from the perspective of an epistemology of science, Gilles Châtelet sees diagrams as “multipliers of virtualities” and “producers of ambiguity” capable of condensing and amplifying an intuition in a way that links past and future (Châtelet 1993, Saint-Ours 2004). Châtelet also emphasises the fact that they are rooted in the gesture of tracing, which renews the links between practice, theoretical activity and semantic-poetic reactivation. On these premises, the interest in the study of diagrams joins that in visual creativity in the practice of science (Galison/Jones 1998, Daston/Galison 2012). It is reinforced within the pictorial and iconic turns that aim to dethrone logocentricity in favour of a recognition of how images work (Mitchell 1994, Böhm 1994 and 2010) and of the role played in them by the “thinking hand” (Bredekamp 2007). This interest is so widespread that in 2002 Steffen and Felix Thürlemann called for a diagrammatical turn (Bogen/Thürlemann 2002), which opens the way to a rich range of reflections (e.g. Stjernfeld 2007, Bauer/Ernst 2010, Krämer 2009, 2012 and 2016). The idea of a “diagrammatology” has led to the use of this prism to interpret images or texts that do not at first glance appear to be diagrams (Bogen 2005, Dahan-Gaida 2023). It should be remembered that in Logique de la sensation, Gilles Deleuze had already envisaged as a diagram the “marks” (dashes-lines, spots-colours) affecting Francis Bacon’s figurative image, and whose function was “to provoke disorder and chaos by destroying an already existing significant regime” while generating a new “capture of forces” (Dahan-Gaida 2023, p. 53). The questions raised by this extension of thinking about the diagram are likely to feed into the workshop discussions. We suggest, however, that the speakers place an examination of the diagrams drawn by artists and writers in the nineteenth and twentieth centuries at the centre of their presentations before turning to the possibility of a generic diagrammatisation of the arts. For example, we might look at the way in which artists interact with the vast amount of religious and scientific diagrams, both Western and non-Western, in order to examine their similarities and differences. On the one hand, diagrams introduce creativity and aesthetics into scientific practices (Baigrie 1996). On the other, their display puts the intangible realities they evoke to the test of the image. This is why, as Brian Rotman points out, diagrams have always seemed suspect, both to scientists because of their formal inadequacy and their openness to subjective interpretation, and to humanists because of their kinship with science and its belief in universal truth (Rotman 1999). How did artists of the nineteenth and twentieth centuries deal with this tension? This is one of the questions we would like to address during this workshop.
In art history, scientific diagrams have been studied from an aesthetic perspective, for example by examining the differences between their drawn and printed forms (Bredekamp 2022). Researchers have also taken a keen interest in art historical diagrams, of which the cover of Alfred Barr’s Cubism and Abstract Art (1936) or Aby Warburg’s Der Bilderatlas Mnemosyne (1828-1829) have become paradigmatic examples (Maldonado 2006, Schmidt-Burkhardt 2012, Cortjaens/Heck 2014, Fontán del Junco 2019). These studies have also uncovered the participation of artists in the visualisation of artistic genealogies, particularly in Italian Futurism (Hanson 1983) and Russian Constructivism (Hemken 1991), among American artists (e.g. Ad Reinhardt, Robert Motherwell), within the SPUR and CoBrA groups (Birtwistle 1994). Finally, the diagrammatic techniques used by artists and writers in the nineteenth and twentieth centuries have been identified and analysed (see the anthology of examples in Caraës/Marchand-Zañartu 2011 and Marchand-Zañartu/Lauxerois 2020). Without being exhaustive, we might mention Walter Crane (Brockington 2013), Rudolf Steiner (Schweigler 1941, Scotti/Kugler 2011), Paul Klee (Rehm 2017, Rottmann 2020-2), Vassily Kandinsky (Leonhard 2005) or, more broadly, the Bauhaus (Troels 1974, Fer 1993, Gough 2005, Rohde 2020) in the context of teaching. From this perspective, several studies have highlighted the participation of artists in the graphic visualisation of data, such as Otto Neurath’s collaboration with Gerd Arntz (Hartmann/Bauer 2003) or El Lissitzky and Hans Arp’s Les ismes dans l’art (Schmidt-Burkhardt 2005). The context of the technical drawing has also led to an assessment of its role in the lists and genealogies of Surrealism (Werner 2002) and in Dada diagrams (Nesbit 1991, Joselit 2005, Bogen 2006, Wild 2015, Wildgen 2015). Their importance in the American context has been highlighted (Shiff 2005, Buchloh 2006) and some of their occurrences studied in Pop Art (Buchloh 1989, Vogt 2008, Gilbertson 2009), the Fluxus movement (Harren 2008, Bardiot 2006, Schmidt-Burkhardt 2003, 2012, 2013), minimal, conceptual and serial art (Geelhaar 1980, Holert 2012, Buchloh 2013, Rottmann 2020-1). These latter examples show that the diagram is part of an emancipation from figuration, an extension of the field of art – we are also thinking of its role in Situationist International – and even the phenomenon of the dematerialisation of art theorised by Lucy Lippard and John Chandler (Harren 2008). However, artists’ diagrams also have a material dimension, resulting from their inscription on a medium, be it paper. This is particularly noticeable when gestural subjectivity manifests itself, as in the diagrams of self-taught artists known as “outsider” (e.g. “Hétérotopies scientifiques”, in Decharme/Safarova 2014 and Barbara 2021). Furthermore, artists’ diagrams often combine abstraction and figuration, as is the case in Pop Art in contrast to serial, conceptual and early attempts at computer art (Rottmann 2020-1 and 2021). These tensions in artists’ diagrams adds to the question of a shared truth by art and science. These tensions in artists’ diagrams are similar to the tensions between art and science. Oscillating between the artist’s withdrawal from the data and subjective reappropriation, they continue to question the visionary faculties of drawing in modernity, as was explicitly the case, for example, with Théophile Bra, Walter Russell, Hilma af Klint, Emma Kunz and Joseph Beuys (Harlan/Zumdick 2020). All in all, as Max Holert argues, “the question of why and how more and more forms of representation were used and put into circulation that may have looked like highly useful images, but as a rule merely suggested functionality, surrounded it with scepticism and irony, and even criticised it, can only be answered on a case-by-case basis” (Holert 2012, p. 141, see also “Der Witz im Diagramm”, in Schmidt-Burkhardt 2012, pp. 293-302). In other words, if “the space of freedom that the diagram leaves for reception is an indicator of the room for manoeuvre that a culture tries to take advantage of in the world” (Bogen 2011, p. 233), what is the space that artists’ diagrams provide?
To address these questions, the proposals will focus on the works of nineteenth- and twentieth-century artists and writers, in order to encourage discussion of the archaeology of the artistic use of diagrams prior to the 1980s, when the revolution in computer-generated digital diagrams reached a crescendo.
Scientific committee
Laurence Dahan-Gaida, professor of comparative literature, University of Franche-Comté, director of the Centre de Recherches Interdisciplinaires et Transculturelles and of the journal Epistémocritique.
Hugo Daniel, head of the École des Modernités, curatorial officer, Fondation Giacometti.
Marine Pagès, artist and teacher, École européenne supérieure de l’image, Poitiers.
Julie Ramos, professor of contemporary art history, University of Strasbourg, USIAS fellow.
Michael Rottmann, Postdoctoral researcher in the ERC-Project COSE at the Institut für Kunst- und Baugeschichte (IKB) at the Karlsruher Institut für Technologie (KIT).
More details
Workshop scheduled for the 6th and 7th of June 2024 at the University of Strasbourg.
Languages: French, English.
Proposals for papers, including a title, a presentation of approximately 3,000 characters with spaces and a biographical note of approximately 1,000 characters with spaces, should be sent before the 31st of December 2023 to the following address: de**********************@***il.com
The selected speakers will be asked to provide a synopsis of their presentation by the end of April. A publication compiling the programme’s three workshops – “Portraits and Faces” (19-20 Oct. 2023), “Orients” (7-8 December) and “Artists’ Diagrams” (6-7 June 2024) – will be prepared once they have been held.
Ich führte eine Kaffeemühle aus, die ich zum Platzen brachte; das Pulver fällt daneben, die Zahnräder sind oben und der Griff ist gleichzeitig an mehreren Punkten seines Verlaufs zu sehen, mit einem Pfeil, der die Bewegung anzeigt. Ohne es zu wissen, hatte ich ein Fenster zu etwas anderem geöffnet. Dieser Pfeil war eine Neuerung, die mir sehr gefiel, die diagrammatische Seite war ästhetisch interessant. (Marcel Duchamp, Entretiens avec Pierre Cabanne, Paris, 1967, S. 38-39)
The diagrammatic methods of the “new math” have led to a curious phenomenon. Namely, a more visible math that is unconcerned with size or shape in any metrical sense. The “paper and pencil operations” that deal with the invisible structure of nature have found new models, and have been combined with some of the more fragile states of mind. (Robert Smithson, « Entropy and the New Monument » [1966], in J. Flam (Hrsg.), Robert Smithson. The Collected Writings, University of California Press, 1996, S. 10-23)
Wenn es eine grafische Linie gibt, die den Wunsch nach einer Visualisierung des Unsichtbaren in sich trägt, dann ist es das Diagramm. Dieser Workshop will untersuchen, wie Künstler im 19. und 20. Jahrhundert mit Diagrammen gearbeitet haben. Durch die Verwendung von Fallstudien soll die Untersuchung von Diagrammen bereits identifizierter Künstler und Schriftsteller erneuert und neue künstlerische Korpora aufgedeckt werden, um ihre Funktionsweise als Bild und Denkprozess sowie ihre Beziehung zu den wissenschaftlichen Visualisierungsmethoden ihrer Zeit zu begreifen.
Seiner Etymologie nach verknüpft das lateinische diagram-ma – entlehnt aus dem altgriechischen diagraphein (διάγραμμα), von dia (durch) und graphein (schreiben) – Linie, Inschrift und den Prozess des Durchquerens. Die Definition des Diagramms variiert, aber üblicherweise versteht man darunter schematische grafische Darstellungen, die abstrakte Daten zueinander in Beziehung setzen, wie z. B. Bäume (Stammbäume oder historische Bäume), Himmels- oder Erdkartografie, relationelle Listen und Tabellen, multidirektionale, kreisförmige, radiale, kurven- oder säulenförmige Konfigurationen. Wie Laurence Dahan-Gaida erklärt, „ruft das Diagramm zwar sofort die Idee der Grafik hervor, doch es zeichnet sich durch seine zusammengesetzte Natur aus, die es zu einem Hybrid aus Schrift und Zeichnung macht, dessen kognitive Fähigkeiten die jeder dieser beiden Zeichenkategorien übersteigen […], dessen allgemeinere Funktion darin besteht, etwas denkbar und verständlich zu machen, über das man nicht hätte sprechen können, wenn man auf verbale Darstellungen zurückgegriffen hätte“ (Dahan-Gaida 2023, S. 12). So setzen die meisten Diagramme Bild-, Text- und manchmal auch Zahlenelemente in einem zweidimensionalen Raum zueinander in Beziehung. Sie lassen Unähnliches oder Diachrones auf topologische und synchrone Weise zusammenlaufen (Bender/Marrinan 2010). Im mittelalterlichen Kontext beschreibt Madeline H. Caviness kosmische und religiöse Diagramme wie eine „dritte Art zu sehen“, die zwischen dem körperlichen Auge und der spirituellen Vision liegt und kurz vor letzterer einsetzt (Caviness 1983). Diagramme haben somit auch eine mnemonische und didaktische Funktion (Schmitt 1989 und 2019, Norman 2006, Müller 2008). Ab der Renaissance tauchten technische und funktionale Diagramme mit wissenschaftlicher Intention auf. Sie dienten zunehmend dazu, geografische, wirtschaftliche, soziale und politische Daten visuell zu organisieren, wie z. B. Statistiken (Gormans 2000). Die Entwicklung von Druckerzeugnissen und später der Presse im 19. Jahrhundert intensivierte die Verbreitung einer wirklich modernen grafischen Methode, die ihre Rezeption durch Künstler förderte (Schneider 2014). Mit dem Ziel, die Kluft zwischen dem Sichtbaren einerseits und den Maßstäben, Kräften oder unsichtbaren Entwicklungen andererseits zu verringern, schien das wissenschaftliche Diagramm damals von dem Wunsch beseelt, die Beschleunigung und Anhäufung von Wissen zu bändigen und eine Antwort auf die Unsicherheit und die Angst zu geben, die durch das Chaos und das Zukünftige hervorgerufen wurden. Die von Diagrammen suggerierte Ordnung wird daher oft von einer bestimmten Welt- und Gesellschaftsvision untermauert, sei es, dass sie Hierarchien aufbaut, wie es häufig bei Baumdiagrammen der Fall ist, oder dass sie Daten eher gleichberechtigt behandelt, wie z. B. bei Kreis- oder Rhizomdiagrammen (Poggenpohl/Winckler 1992). Seit den Arbeiten von Charles Sanders Peirce wird die scheinbare Starrheit des Diagramms jedoch durch seine Fähigkeit, Ideen zu beflügeln, in Frage gestellt. Es entstand die Idee, dass das Diagramm eher ein „epistemisches Ding“ als eine bloße Illustration ist (Rheinberger 2001). Indem Peirce sie zu einer Unterkategorie der Ikonen machte, konzentrierte er sich auf ihre Beziehung der Ähnlichkeit und Analogie zu ihrem Bezugsobjekt sowie auf ihre Bilddimension und erkannte in ihnen ein Medium des Denkens, das sowohl am Erwerb als auch an der Gewinnung von Wissen beteiligt sein kann. Peirce betont die relationelle Dimension des Diagramms, unabhängig davon, ob es sich um Objekte, Konzepte oder Ideen oder sogar um verschiedene Wissensbereiche handelt, eine Dimension, die eine experimentelle und operative Handhabung und Interpretation der Figuren, Legenden, Symbole, Zahlen, Punkte, Linien oder Pfeile, die es zusammenstellt, erfordert (Dahan-Gaida 2023, Krämer 2009). Das Diagramm beinhaltet also sowohl seine Gestaltung durch den Zeichner als auch seine Rekonfiguration durch die Empfänger, die Ableitung seiner funktionalen Regeln und die Fähigkeit, das Geheimnisvolle in ihm zu entschlüsseln (Stjernfeld 2007). Aus diesem Grund betrachtet Gilles Châtelet aus der Perspektive einer Epistemologie der Wissenschaften Diagramme als „Multiplikatoren von Virtualitäten“ und „Produzenten von Mehrdeutigkeit“, die eine Intuition auf eine Weise verdichten und verstärken können, die Vergangenheit und Zukunft miteinander verbindet (Châtelet 1993, Saint-Ours 2004). Châtelet betont auch ihre Verankerung in der Geste des Zeichnens, welche die Praxis, theoretischer Aktivität und semantisch-poetischer Reaktivierung verbinden. Unter diesen Prämissen schließt das Interesse an der Untersuchung von Diagrammen an dasjenige an visueller Kreativität in der wissenschaftlichen Praxis an (Galison/Jones 1998, Daston/Galison 2012). Es verstärkt sich im Rahmen der pictorial und iconic turns, die darauf abzielen, den Logozentrismus zugunsten einer Berücksichtigung der Funktionsweise von Bildern (Mitchell 1994, Böhm 1994 und 2010) und der Rolle, die die „denkende Hand“ (Bredekamp 2007) in ihnen spielt, zu übertrumpfen. Dieses Interesse nimmt ein solches Ausmaß an, dass Steffen und Felix Thürlemann 2002 zu einem diagrammatical turn aufrufen (Bogen/Thürlemann 2002), der den Weg für eine Vielzahl von Denkanstößen ebnet (z. B. Stjernfeld 2007, Bauer/Ernst 2010, Krämer 2009, 2012 und 2016). Die Idee einer „Diagrammatologie“ hat unter anderem dazu geführt, dass Bilder oder Texte, die sich auf den ersten Blick nicht als Diagramme zu erkennen geben, durch dieses Prisma interpretiert werden (Bogen 2005, Dahan-Gaida 2023). Wir erinnern daran, dass Gilles Deleuze in Logique de la sensation bereits die „Markierungen“ (Striche-Linien, Flecken-Farben), die bei Francis Bacon das figurative Bild beeinflussen, als Diagramm betrachtete und deren Funktion darin bestand, „Unordnung und Chaos zu verursachen, indem sie ein bereits bestehendes signifikantes Regime zerstören“ und gleichzeitig einen neuen „Kräfteeinfang“ erzeugen (Dahan-Gaida 2023, S. 53). Die Fragen, die durch diese Erweiterung der Überlegungen zum Diagramm aufgeworfen werden, können die Diskussionen des Workshops bereichern. Wir schlagen jedoch vor, dass die Teilnehmerinnen und Teilnehmer zunächst die Diagramme von Künstlern und Schriftstellern des 19. und 20. Jahrhunderts untersuchen, bevor sie sich mit der Möglichkeit einer allgemeinen Diagrammatisierung der Künste befassen. So könnte beispielsweise untersucht werden, wie die Künstler mit dem umfangreichen Korpus an religiösen und wissenschaftlichen, westlichen und nicht-westlichen Diagrammen umgehen, um deren Gemeinsamkeiten und Unterschiede zu erörtern. Einerseits bringen Diagramme Kreativität und Ästhetik in die wissenschaftliche Praxis ein (Baigrie 1996). Andererseits stellt ihre Darstellung die unbegreifliche Realität, die sie heraufbeschwören, auf die Probe des Bildes. Aus diesem Grund sind Diagramme, wie Brian Rotman bemerkt, schon immer verdächtig erschienen, sowohl den Wissenschaftlern wegen ihrer formalen Unzulänglichkeit und ihrer Offenheit für subjektive Interpretationen als auch den Humanisten wegen ihrer Verwandtschaft mit der Wissenschaft und ihrem Glauben an eine universelle Wahrheit (Rotman 1999). Wie gehen die Künstler des 19. und 20. Jahrhunderts mit dieser Spannung um? Dies ist eine der Fragen, die wir im Workshop erörtern möchten.
In der Kunstgeschichte hat man begonnen, wissenschaftliche Diagramme unter ästhetischen Gesichtspunkten zu untersuchen, indem man zum Beispiel die Unterschiede zwischen ihren gezeichneten und gedruckten Formen betrachtet (Bredekamp 2022). Darüber hinaus haben sich die Forscher umfassend mit kunsthistorischen Diagrammen befasst, für die das Titelbild von Alfred Barrs Cubism and Abstract Art (1936) oder Aby Warburgs Der Bilderatlas Mnemosyne (1828-1829) zu paradigmatischen Beispielen geworden sind (Maldonado 2006, Schmidt-Burkhardt 2012, Cortjaens/Heck 2014, Fontán del Junco 2019). Diese Studien haben auch die Beteiligung von Künstlern an der Visualisierung künstlerischer Genealogien aufgedeckt, insbesondere im italienischen Futurismus (Hanson 1983) und im russischen Konstruktivismus (Hemken 1991), bei amerikanischen Künstlern (z. B. Ad Reinhardt, Robert Motherwell), innerhalb der SPUR- und CoBrA-Gruppen (Birtwistle 1994). Und schließlich wurden die diagrammatischen Praktiken von Künstlern und Schriftstellern des 19. und 20. Jahrhunderts identifiziert und analysiert (vgl. die Fülle von Beispielen in Caraës/Marchand-Zañartu 2011 und Marchand-Zañartu/Lauxerois 2020 ). Ohne Anspruch auf Vollständigkeit sind Walter Crane (Brockington 2013), Rudolf Steiner (Schweigler 1941, Scotti/Kugler 2011), Paul Klee (Rehm 2017, Rottmann 2020-2), Wassily Kandinsky (Leonhard 2005) oder im weiteren Sinne das Bauhaus (Troels 1974, Fer 1993, Gough 2005, Rohde 2020) im Rahmen des Unterrichts zu nennen. In diesem Zusammenhang haben mehrere Studien die Beteiligung von Künstlern an der grafischen Visualisierung von Daten hervorgehoben, wie z. B. die Zusammenarbeit von Otto Neurath und Gerd Arntz (Hartmann/Bauer 2003) oder von El Lissitzky und Hans Arp für Les ismes dans l’art (Schmidt-Burkhardt 2005). Der Kontext der technischen Zeichnung hat auch dazu geführt, ihre Rolle in den Listen und Genealogien des Surrealismus (Werner 2002) und in den Dada-Diagrammen (Nesbit 1991, Joselit 2005, Bogen 2006, Wild 2015, Wildgen 2015) zu untersuchen. Ihre Bedeutung im amerikanischen Kontext wurde hervorgehoben (Shiff 2005, Buchloh 2006) und einige ihrer Erscheinungen in der Pop Art (Buchloh 1989, Vogt 2008, Gilbertson 2009), der Fluxus-Bewegung (Harren 2008, Bardiot 2006, Schmidt-Burkhardt 2003, 2012, 2013), der Minimal-, Konzept- und seriellen Kunst (Geelhaar 1980, Holert 2012, Buchloh 2013, Rottmann 2020-1) erforscht. Die letzteren Beispiele zeigen, dass das Diagramm Teil einer Emanzipation von der Figuration, einer Ausweitung des Kunstbereichs – man denke auch an seine Rolle in der Situationistischen Internationale – und sogar des von Lucy Lippard und John Chandler theoretisierten Phänomens der Dematerialisierung der Kunst ist (Harren 2008). Künstlerdiagramme haben jedoch auch eine materielle Dimension, da sie auf ein Medium, und sei es Papier, aufgezeichnet werden. Dies ist vor allem dann der Fall, wenn sich die Subjektivität der Gestik in den Diagrammen manifestiert, wie es bei den Diagrammen von autodidaktischen Künstlern der Fall ist, die als „Brut“ und „outsider“ bezeichnet werden (z. B. „Hétérotopies scientifiques“, in Decharme/Safarova 2014 und Barbara 2021). Darüber hinaus verbinden Künstlerdiagramme häufig Abstraktion und Figuration, wie es in der Pop Art im Gegensatz zur seriellen und konzeptuellen Kunst und den frühen Versuchen der Computerkunst der Fall ist (Rottmann 2020-1 und 2021). Diese Spannungen in den Künstlerdiagrammen kommen zu der Frage nach der Wahrheit in Kunst und Wissenschaft hinzu. Sie schwanken zwischen dem Verschwinden des Künstlers vor den Daten und der subjektiven Wiederaneignung und hinterfragen weiterhin die visionären Fähigkeiten der Zeichnung in der Moderne, wie es beispielsweise bei Theophile Bra, Walter Russell, Hilma af Klint, Emma Kunz und Joseph Beuys explizit der Fall war (Harlan/Zumdick 2020). Alles in allem, so Max Holert, lässt sich die Frage „warum und wie vermehrt Darstellungsformen zum Einsatz kamen und in Umlauf gebracht wurden, die zwar wie eminent nützliche Bilder aussahen, aber Funktionalität in der Regel eher andeuteten, skeptisch-ironisch umspielten oder kritisieren, […] daher nur von Fall zu Fall zu beantworten“ (Holert 2012, S. 141, siehe auch „Der Witz im Diagramm“, in Schmidt-Burkhardt 2012, S. 293-302). Mit anderen Worten: „Die Freiheit, die das Diagramm in der Rezeption lässt, wird zum Indikator für den Spielraum, den eine Kultur in der Welt auszuschöpfen versucht“ (Bogen 2011, S. 233), doch welche Freiheit lassen die Künstlerdiagramme zu?
Um diese Fragen zu beleuchten, sollen sich die Beitragsvorschläge auf die Korpora von Künstlern und Schriftstellern des 19. und 20. Jahrhunderts konzentrieren, um Diskussionen über die Archäologie des künstlerischen Gebrauchs von Diagrammen vor den 1980er Jahren zu ermöglichen, als die Revolution der computergenerierten digitalen Diagramme ihren Höhepunkt erreichte.
Wissenschaftliches Auswahlkomitee
Laurence Dahan-Gaida, Professorin für vergleichende Literaturwissenschaft, Universität Franche-Comté, Direktorin des Centre de Recherches Interdisciplinaires et Transculturelles und der Zeitschrift Epistémocritique.
Hugo Daniel, Leiter der École des Modernités, kuratorischer Beauftragter, Fondation Giacometti.
Marine Pagès, Künstlerin und Lehrerin, École européenne supérieure de l’image, Poitiers.
Julie Ramos, Professorin für zeitgenössische Kunstgeschichte, Universität Straßburg, USIAS-Fellow.
Michael Rottmann, Postdoktorand im ERC-Projekt COSE am Institut für Kunst- und Baugeschichte (IKB) des Karlsruher Institut für Technologie (KIT).
Nützliche Informationen
Workshop geplant am 6. und 7. Juni 2024 an der Universität Straßburg.
Sprachen: Französisch, Englisch.
Die Beitragsvorschläge, bestehend aus einem Titel, einer Präsentation von ca. 3000 Zeichen inkl. Leerzeichen und einer biografischen Notiz von ca. 1000 Zeichen inkl. Leerzeichen, sind bis zum 31. Dezember 2023 an folgende Adresse zu senden: de**********************@***il.com
Die ausgewählten Teilnehmer.innen werden gebeten, Ende April eine kurze Zusammenfassung ihres Vortrags einzureichen. Die drei Workshops des Programms – „Porträts und Gesichter“ (19.-20. Okt. 2023), „Oriente“ (7.-8. Dez.), „Künstlerdiagramme“ (6.-7. Juni 2024) – werden nach ihrer Durchführung in einer gemeinsamen Publikation veröffentlicht.
Bibliographie/Bibliography/Bibliografie
Baigrie B. S. 1996 (dir.) : Picturing Knowledge. Historical and Philosophical Problems Concerning the Use of Art in Science, University of Toronto Press, coll. « Toronto Studies in Philosophy ».
Barbara J.-G. 2021 : Art brut et science. L’utopie cynbernétique de Jean Perdrizet, Éditions Hermann.
Bardiot C. 2006 : « The diagrams of 9 evenings », in Morris C. (éd.), 9 evenings reconsidered : art, theater and engineering, 1966, MIT List Visual arts center, p. 45-53.
Bauer M./Ernst C. 2010 (dir.) : Diagrammatik. Einführung in ein kultur- und medienwissenschaftliches Forschungsfeld, transcript Verlag.
Bender J./Marrinan M. 2020 : The Culture of Diagram, Stanford University Press.
Birtwistle G. 1994 : « Die Suche nach Struktur in Asger Jorns Theorie », in Messer T. M. (dir.), Asger Jorn. Retrospektive, cat. exp. Schirn Kunsthalle Frankfurt a. M., p. 21-29.
Buchloh B. H. D. 1989 : « One Dimensional etc. », in McShine K. (dir.), Andy Warhol : A Retrospective, cat. exp. Museum of Modern Art New York, p. 39-61.
Buchloh B. H. D. 2006 : « Hesse’s Endgame: Facing the Diagram », in Zehger C (éd.), Eva Hesse Drawing, cat. exp. The Drawing Center, p. 117-150.
Buchloh B. H. D. 2013 : « Painting as Diagram: Five Notes on Frank Stella’s Early Paintings, 1958-1959 », October, n° 143, p. 126-144.
Böhm G. 1994 : Was ist ein Bild?, W. Fink.
Böhm G. 2010 : « Ce qui se montre. De la différence iconique », in Alloa E. (dir.), Penser l’image, Les presses du réel, p. 27-47.
Bogen S. 2005 : « Schattenriss und Sonnenuhr. Überlegungen zu einer kunsthistorischen Diagrammatik », Zeitschrift für Kunstgeschichte, vol. 58, n° 2, p. 153-176.
Bogen S. 2007 : « Logische und ästhetische Experimente. Diagramme bei Pierce und Duchamp », in Lammert A. et al. (dir.), Räume der Zeichnung, Verlag für moderne Kunst, p. 38-56.
Bogen S. 2011 : « Zwischen innen und außen. Für eine Pragmatik des Diagrammatischen », Heinrich R. et al. (dir.), Image and Imaging in Philosophy, Science and the Arts. Volume 2, série « Publications of the Austrian Ludwig Wittgenstein Society », vol. 17, De Gruyter, p. 229-248.
Bogen S./Thürlemann F. 2002 : « Jenseits der Opposition von Text und Bild. Überlegungen zu einer Theorie des Diagramms und des Diagrammatischen », in Patschovsky A. (dir.), Die Bildwelt der Diagramme Joachims von Fiore. Zur Medialität religiös-politischer Programme im Mittelalter, Thorbecke, p. 1-22.
Bredekamp H. 2007 : « Denkende Hände. Überlegungen zur Bildkunst der Naturwissenschaften », in Lammert A. et al. (dir.), Räume der Zeichnung, Verlag für moderne Kunst, p. 109-132.
Bredekamp 2022 : Les coraux de Darwin [2008], trad. de l’allemand par C. Joschke, Les presses du réel.
Brockington G. 2012 : « Rhytming pictures: Walter Crane and the universal language of art », Word & Image: A Jounal of Verbal/Visual Enquiry, vol. 28, n° 4, p. 359-373.
Caraës M.-H./Marchand-Zañartu N. 2011: Images de pensée, Réunion des Musées Nationaux.
Caviness H. M. 1983 : « Images of Divine Order and the Third Mode of Seeing », Gesta, vol. 22, n° 2, p. 99-120.
Châtelet G. 1993 : Les Enjeux du mobile. Mathématique, physique, philosophie, Seuil, coll. « Des travaux ».
Cortjaens W./Heck K. (dir.) 2014 : Stil-Linien diagrammatischer Kunstgeschichte, Deutscher Kunstverlag, coll. « Transformationen des Visuellen ».
Dahan-Gaida L. 2023 : L’art du diagramme. Sciences, littérature, arts, Presses universitaires de Vincennes, coll. « L’Imaginaire du Texte ».
Daston L./Galison P. 2012 : Objectivité [2007], Les presses du réel.
Decharme B./Safarova B. 2014 (dir.) : Art brut, collection abcd/Bruno Decharme, cat. exp. La maison rouge, Paris.
Fer B. 1993 : « The Language of Construction », in Realism, Rationalism, Surrealism: Art between the Wars, Yale Univerity Press, p. 87-169.
Fontán del Junco M. 2019 : Genealogies of Art, or the History of Visual Art, cat. exp. Fundación Juan March, Museo Picasso, Málaga.
Galison P./Jones C. A. 1998 (dir.) : Picturing science, producing art, Routledge.
Geelhaar C. 1980 (dir.) : Frank Stella. Working Drawings : Zeichnungen 1956-1970, cat. exp. Kunstmuseum Basel.
Gilbertson L. 2009 : Bodies Out of Time and Place: Queerly Present in Andy Warhol’s Factory and Beyond, PhD, University of Rochester.
Gormans A. 2000 : « Imaginationen des Unsichtbaren. Zur Gattungstheorie des wissenschaftlichen Diagramms », in Holländer H. (dir.), Erkenntnis, Erfindung, Konstruktion. Studien zur Bildgeschichte von Naturwissenschaften und Technik vom 16. bis zum 19. Jahrhundert, Gebr. Mann Verlag, p. 51-71.
Gough M. 2005 : The Artist as Producer: Russian Constructionism in Revolution, University of California Press.
Hanson A. C. 1983 : The Futurist Imagination. Word + Image in Italian Futurist Painting, Drawing, Collage and Free-Word Poetry, cat. exp. Yale University Art Gallery.
Harlan V./Zumdick W. 2020 : Mit Beuys Evolution denken: Dreigliederung als Weltprinzip in der Evolution von Natur, Kultur und Gesellschaft: ausgehend von der Diagramm-Zeichnung vom 1. Juli 1974, Schirmer/Mosel.
Harren N. 2008 : « The diagram dematerialized, from Marcel Duchamp to John Cage to George Brecht », Athanor, n° 26, p. 99-105.
Hartmann F./Bauer E.K. 2003 (dir.) : Bildersprache. Otto Neurath. Visualisierungen, facultas.wus.
Hemken K.-U. 1991 : « Weltharmonie und Kraftsystem. Das Buch neuer Künstler (1922) als Bildmanifest des ungarischen Konstruktivismus », fascicule publié à l’occasion du reprint de Kassák L./ Moholy-Nagy L., Buch neuer Künstler, Verlag Lars Muller, s.p.
Holert T. 2012 : « “A fine flair for the diagram”. Wissensorganisation und Diagramm-Form in der Kunst der 1960er Jahre: Mel Bochner, Robert Smithson, Arakawa », in Leeb (dir.), Materialität der Diagramme. Kunst und Theorie, b.books, coll. « PoLYpeN », p. 135-178.
Joselit D. 2005, « Dada’s Diagrams », in Dickerman L. et al. (dir.) The Dada Seminar, Center for Advanced Study in Visula Arts, National Gallery Of Art, p. 221-239.
Krämer S. 2009 : « Operative Bildlichkeit. Von der „Grammatologie“ zu einer „Diagrammatologie“? Reflexionen über erkennendes „Sehen“ », in Heßler M. et Mersch D. (dir.), Logik des Bildlichen. Zur Kritik der ikonischen Vernunft, transcript Verlag, p. 94-122.
Krämer S. 2012 : « Punkt, Strich, Fläche. Von der Schriftbildlichkeit zur Diagrammatik », in Cancik-Kirschbaum E. et al. (dir.) Schriftbildlichkeit. Wahrnehmbarkeit, Materialität und Operativität von Notationen, De Gruyter, p. 79-101.
Krämer S. 2016 : Figuration, Anschauung, Erkenntnis. Grundlinien einer Diagrammatologie, Suhrkamp.
Leonhard K. 2005, « Bild und Zahl. Das Diagramm in Kunst und Naturwissenschaft am Beispiel Wassily Kandinskys und Felix Auerbachs », in Zimmermann A. (dir.), Sichtbarkeit und Medium. Austausch, Verknüpfung und Differenz naturwissenschaftlicher und ästhetischer Bildstrategien, Hamburg University Press, p. 231-245.
Maldonado G. 2006 : « Du temps où l’art moderne était contemporain ou L’histoire de l’art en graphes », Pratiques, n° 17, n° 1-2, p. 211-241.
Marchand-Zañartu N./Lauxerois J. 2020 : 32g de pensée. Essai sur l’imagination graphique, Médiapop Éditions.
Mitchell W. J. T. 1994 : Picture Theory. Essays on Verbal and Visual Representation, University of Chicago Press.
Müller K. 2008 : Visuelle Weltaneignung. Astronomische und kosmologische Diagramme in Handschriften des Mittelalters, Vandenhoeck & Ruprecht, coll. « Historische Semantik ».
Nesbit M 1991 :« The Language of Industry », in De Duve T. (dir.), The Definitively Unfinished Marcel Duchamp, MIT Press.
Norman J. 2006 : After Euclid. Visual Reasoning and the Epistemology of Diagrams, CSLI Publications.
Poggenpohl S. H./ Winckler D. R. 1992 (dir.) : Diagrams as Tools of Worldmaking, Visible Language, vol. 26, n° 3-4.
Rehm R. 2017 : Die Welt des Auges: Evokative Diagramme bei Newton, Goethe, Lipps und Klee, Mann.
Rheinberger H.-J. 2001 : Experimentalsysteme und epistemische Dinge. Eine Geschichte der Proteinsynthese im Reagenzglaz, Wallstein.
Rohde T. 2020 : « Gemalte Diagramme. Zur Beziehung von Kunst und Informationsdesign vom Bauhaus bis in die Gegenwart », in Gronert. S. et Schwer T. (dir.), Im Zeichen des Bauhauses 1919-2019. Kunst und Technik im Digital Turn, AV Edition, p. 70-81.
Rotman B. 1999 : « Thinking Dia-grams: Mathematics and Writing », in Biagioli M. (dir.), The Science Studies Reader, Routledge, p. 430-441.
Rottmann M. 2020-1: Gestaltete Mathematik. Geometrien, Zahlen und Diagramme in der Kunst in New York um 1960. Mel Bochner – Donald Judd – Sol LeWitt – Ruth Vollmer, Edition Metzel/Verlag Silke Schreiber.
Rottmann M 2020-2 : « Paul Klees „Honigschrift“: Überlegungen zum Verhältnis von Automatismus, Automatisierung, Maschinen und Mathematik », Zwitscher-Maschine. Journal on Paul Klee, n° 9, p. 42-61.
Rottmann M. 2021 : « Programm und Diagramm. Überlegungen zum digitalen Bild und zur Automatiesierung anhand der Computergraphik der 1960er Jahre von Frieder Nake », Kunstgeschichte. Open Peer Review Journal : https://www.kunstgeschichte-ejournal.net/589/.
de Saint-Ours A. 2004 : « Les sourires de l’être », in Théorie, littérature, épistémologie, n° 22, p. 1-28.
Schweigler E. 1941 : Rudolf Steiner als illustrierender Künstler, Goetheanum.
Schmidt-Burkhardt A. 2003 : Maciunas’ Learning Machines. From Art History to a Chronology of Fluxus, Gilbert and Lila Silverman Fluxus Collection/Vice Versa Verlag.
Schmidt-Burkhardt A. 2005 : Stammbäume der Kunst: Zur Genealogie der Avantgarde, Berlin.
Schmidt-Burkhardt A. 2009 : « Wissen als Bild. Zur diagrammatischen Kunstgeschichte », in Heßler M. et Mersch D. (dir.), Logik des Bildlichen. Zur Kritik der ikonischen Vernunft, transcript Verlag, p. 163-187.
Schmidt-Burkhardt A. 2012 : Die Kunst der Diagrammatik. Perspektiven eines bildwissenschaften Paradigmas, transcript Verlag, coll. « Image ».
Schmidt-Burkhardt A. et al. 2013 (dir.) : Fluxus, Russian Atlases: a Selection from the Jonas Mekas Visual Arts Center, cat. exp. Herm.
Schmitt J.-C. 1989 : « Les images classificatrices », Actualité de l’Histoire à l’École des Chartes, Droz, p. 311-341.
Schmitt J.-C. 2019 : Penser par figures. Du compas divin au diagramme magique, Arkhé.
Schneider B. 2014 : « Ohne Linien ist der Geist Blind. Elemente einer Praxis- und Wissensgeschichte der explorativen Grafik », in Cortjaens W./Heck K. (dir.) 2014 : Stil-Linien diagrammatischer Kunstgeschichte, Deutscher Kunstverlag, coll. « Transformationen des Visuellen », p. 66-79.
Scotti R./Kugler W. 2011 : Ich bin das Bild der Welt: Rudolf Steiner – Wandtafelzeichnungen ; Otto Rietmann – Photographien, cat. exp. Museum Liner Appenzell, Stiftung Liner Appenzell.
Shiff R. 2005 : « Newman’s Time », in Ho M. (dir.), Reconsidering Barnett Newman, The Philadelphia Museum of Art, p. 161-179.
Stjernfeld F. 2007 : Diagrammatology. An Investigation on the Borderlines of Phenomenology, Ontology and Semiotics, Springer, coll. « Synthese library ».
Troels A. 1974 : « Zu den Tafeln von Malewitsch. Analyse einer Kunstauffassung », in Kunst – Über Kunst, cat. exp. Kölnischer Kunstverein, p. 15-16.
Vogt T. 2008 : « Roy Lichensteins Lehre. Transformationen des Portrait de Mme Cézanne », in Hoffmann T. (dir.), Lehrer ohne Lehre: Zur Rezeption Paul Cézannes in Künsten, Wissenschaften und Kultur (1906-2006), Rombach litterae, p. 43-59.
Werner G. 2002 : Mathematik im Surrealismus : Man Ray – Max Ernst – Dorothea Tanning, Jonas Verlag.
Wild J. 2015 : « Apollinaire’s Aura. Picabia, the Diagram, and Early Film Stardom » et « Duchamp’s Diagrams: Film, Spectator, Star, in The Parisian Avant-Garde in the Age of Cinema, 1900-1923, University of California Press, p. 62-101 et 104-134.
Wildgen W. 2015 : « Sculpture, Diagram, and Language in the Artwork of Joseph Beuys », in Bundgaard P. et Stjernfelt F. (dir.), Investigations Into the Phenomenology and the Ontology of the Work of Art. Contributions To Phenomenology, vol. 81, p. 243-257.